 's
Scientific Python Tools
's
Scientific Python Tools
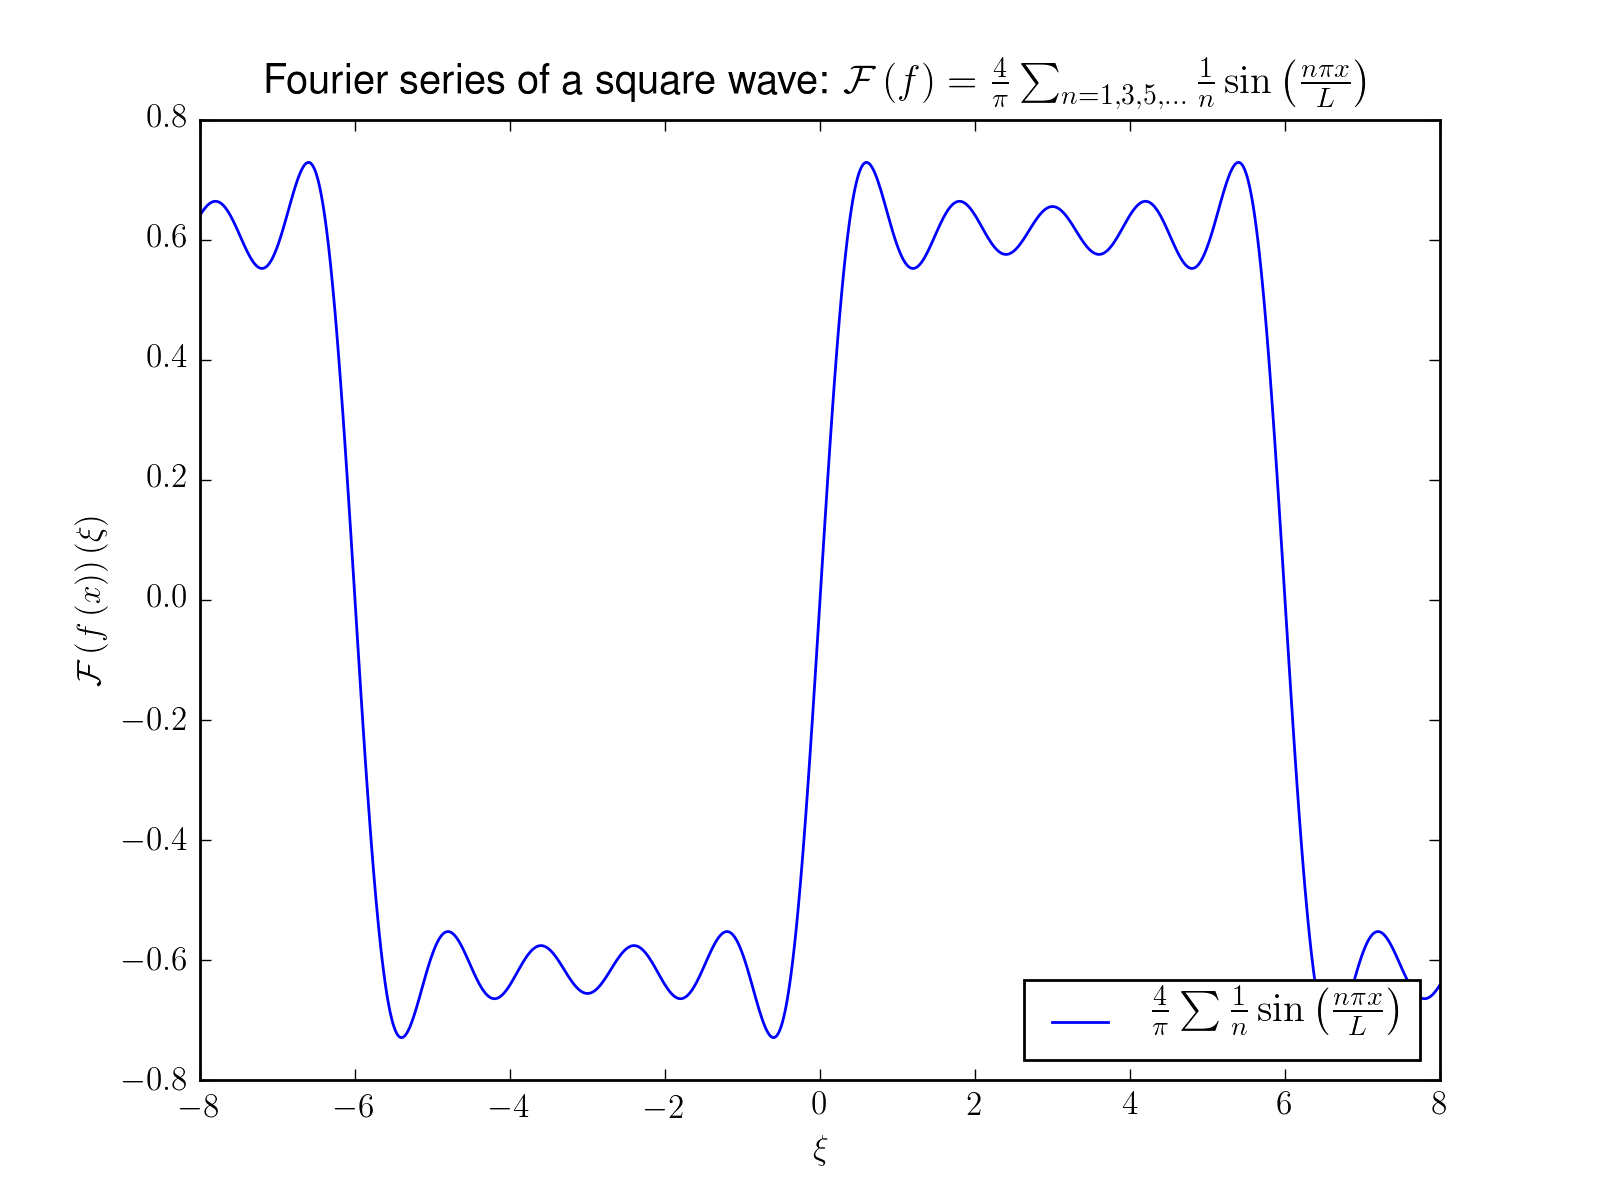
The plotting utilities of matplotlib can use the power of a TeX system if one is installed. We just have to tell matplotlib that it should generate the labels with the help of TeX. We then can use anything that is a valid TeX expression we would otherwise write between the dollar signs in a TeX file. The following code presents a small example showing TeX labels in action.
NOTE: you may have issues with the following usetex-options in case that latex is bad configured on MacOS or Windows.
from numpy import *
from pylab import *
from matplotlib import rc

# Enable usage of real TeX for labels and captions
rc('text', usetex=True)

# Build a complicated function
x = linspace(-8, 8, 5000)

y = zeros(x.shape)
for n in xrange(1,11,2):
    y += 1.0 / n * sin(n * pi * x / 6.0)
y = pi / 4.0 * y

# Plot and label with full TeX support
figure()
plot(x, y, label=r"$\frac{4}{\pi} \sum \frac{1}{n} \sin\left( \frac{n \pi x}{L} \right)$")
xlabel(r"$\xi$")
ylabel(r"$\mathcal{F}\left(f\left(x\right)\right)\left(\xi\right)$")
legend(loc="lower right")
title(r"Fourier series of a square wave: $\mathcal{F}\left(f\right) = \frac{4}{\pi} \sum_{n=1,3,5,\ldots} \frac{1}{n} \sin\left( \frac{n \pi x}{L} \right)$")
savefig("tex_labels.png")
(Source code, png, hires.png, pdf)
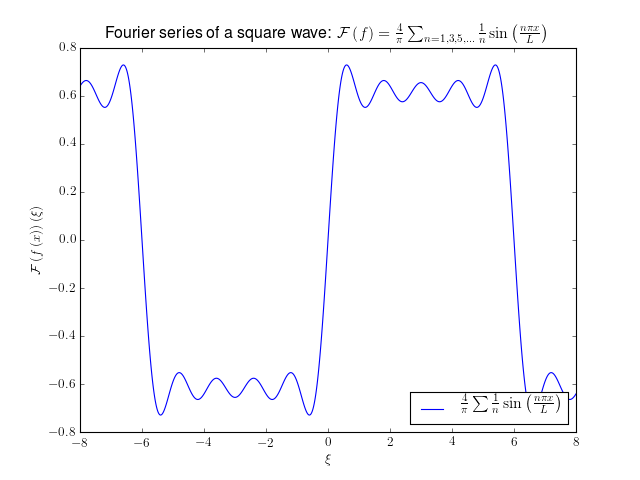
Note that we have to use so called raw strings, i.e. strings with the character r as a prefix. Additionally we use the dollar signs inside the strings for delimiting formulas as usual.