 's
Scientific Python Tools
's
Scientific Python Tools
While you saw several plot command and know how to do different 2D and 3D plots, we will list here some other plot command that might be interesting.
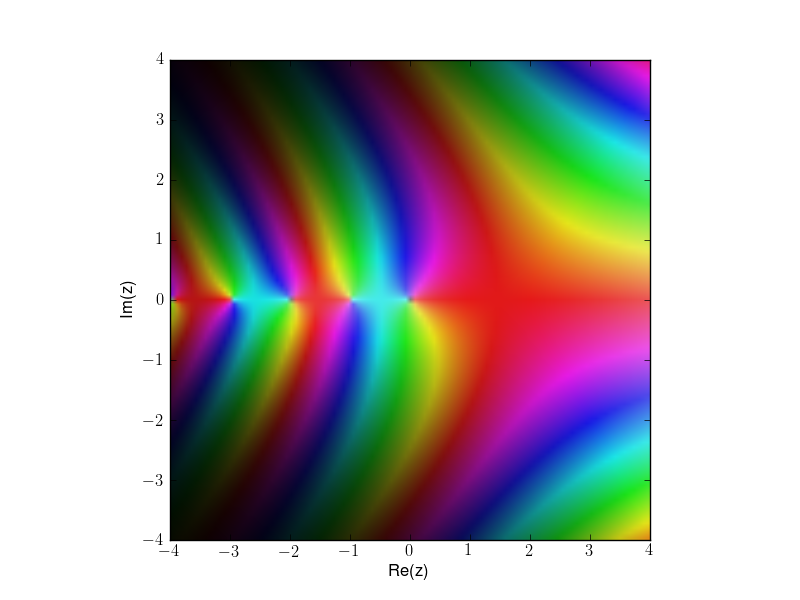
Plots of a possibly complex function in the complex plane can be easily done with plot routines from the mpmath python package.
The example plots the gamma function over the complex plane:
import mpmath as mp

mp.cplot(mp.gamma, re=[-4,4], im=[-4,4], points=10000, file="gamma.png")
This is all for plotting the gamma function in the rectangle -4 < Re(z) < 4 and -4 < Im(z) < 4. The above call saves the result to the file “gamma.png” which looks like this: